
Data Practice
Self-Service Analytics: Are They Over or Have They Even Started?
Published
June 19, 2024
Read Time
5 minutes
Topics
Enabling analytics at scale

Read Time
5 minutes
Topics
Enabling analytics at scale
A blogger recently described self-service analytics as something that every data-driven organization strives for. Another noted that we’ve had self-service analytics for 30 years. Who’s correct?
On one level, nearly everyone in corporate environments is already doing self-service analytics. Across roles and departments, people are trying to understand their environment, what’s changing, and how they can make a better decision tomorrow versus yesterday. Any time they’re using recorded information to do that rather than their own gut feel, that’s analytics.
On the other hand, this widespread use of data is all in spreadsheets, which begs the question, does this meet the bar of self-serve analytics? The Chief Data Officer of Bentley Motors recently defined the first step of self-service analytics as getting people out of Excel, where too much energy gets expended in producing a dashboard, and getting them into working with data visualization tools that are more flexible, provide greater access to data, are more effective in conveying results, and easier to update.
Without question, organizations need to improve the way they make decisions, understand their world better, and do it more today than they did in the past. That means they need to revisit how they understand things and test assumptions more often than they used to. Creating an effective self-service analytics framework can enable all of these things, but what are the barriers?
Only visualize
As Bentley’s Moore rightly points out, the problem with most self-service analytics is that they begin and end in spreadsheets. Kevin Wright notes in his famous post about Alberto Cairo’s Datasaurus scatterplot that relying on data summaries such as means, variances, and correlations is shortsighted because it can yield similar results from wildly different data sets. What can be plotted as a star, in his example, can also be plotted as a dinosaur.
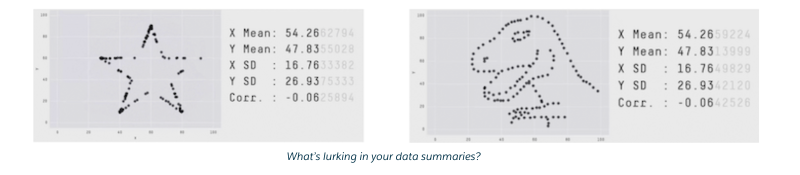
Another way to state the case is that if you’re looking only at reported information, you’re not really challenging and developing your understanding of the world. Evolve to complete information visualizations, however, and any trained eye can suddenly see more trends and patterns, ask more questions, understand things better, and make more informed decisions to improve what they’re doing.
Meeting specs vs. answering business questions
Why are so many companies still chained to manually intensive ways to express their data? It may be linked to the way organizations historically have been organized.
IT departments emerged to set up systems in a world where data wasn’t really digitized. That was hard. Files were all over the place, and early IT had to put a lot of structure around data to fit it into systems that were rigid and basic compared to today’s standard software.
The rules around early IT could be summarized as, “This is what you’re allowed to do, this is when you do it, this is how you do it. Any deviation from this path is not acceptable.” I believe a whole world of data grew up around that definition – bringing IT to companies using fragile systems when technology was immature. That’s completely different to where most analysis happens today within lines of business.
IT, in other words, grew out of an era of exactly meeting a relatively static spec within a 1 percent deviation of consequences. Lines of business, on the other hand, grew out of needing to answer questions within a reasonable tolerance and a reasonable level of precision, but where questions changed quickly. IT was managing systems that had no agility, leniency, or tolerance for error.
You can follow this historical path to where many organizations are still stuck today.
Ideal self-service analytics
When I think about what an ideal self-service analytics framework looks like, I imagine the experience of a new hire.
If you are expected to work with data in your role, your onboarding would include being told:
- These are the tools you use to do data work in your organization
- This is where you save data work and go to understand what already exists
- If something’s not right, this is where you go to log it and how it gets prioritized
The same example would hold true for onboarding any other professional. An engineer would be told the tools, like CAD, used for engineering, where to save design versions and how to raise engineering risks. HR professionals would be told the systems used for managing teams and recruitment and where to read up on HR policies and processes.
Yet most businesses have not professionalized their data activities in the same way. There are no standard tools, standard methods for version control or processes for continual improvement of data. Data work hasn’t really been regarded as a professional activity. Either people have associated data analysis with what IT did, which turned the focus almost exclusively to system governance, or with what junior staff did, which you no longer thought about once you reached senior levels. Ideally, all data work should be done consistently and on the same platform in every function, because we ought to be managing businesses without silos. HR teams ought to be using the same data tools as finance teams. This has happened in a few organizations, but most are many years behind the curve here.
Giving analytics a better way forward
If you believe, as I do, that self-service analytics has always been there, the question becomes, how can it be professionalized and evolve to its full potential? Here are a few strategies I’d pursue.
- Move analytics to the cloud. If you agree that self-service analytics should be a priority, the cloud gives you the opportunity to de-silo data for the first time and to link together everyone’s data calculations. Purchasing can then link to finance, finance can link to engineering, and so on. That requires standardization, which enables organizations to run fundamentally differently and to operate at scale in a much more effective way. But it also requires that self-service analytics be a managed topic and a priority for the company.
- Decentralize analytics. Upskilling the org to do automated data work on the cloud also allows data science teams to move up the value chain by decentralizing the task of creating dashboards. If everyone’s got the capability to create them and everyone is trained to do it, suddenly you free up the central team to do higher-value work such as algorithm development. You can’t measure the value of all distributed data work but if you sample some of the projects that are done outside your team, you massively expand resources and capability straight away.
- Put CDOs in charge. The data community keeps saying, “CDOs should be on the board.” In order for this to be true CDOs need to accept the same level of enterprise remit as other board members. The chief finance officer has responsibility for all finance decisions, even though they may not be in their function, and the chief customer officer considers all the implications for the customer regardless of which function they come from. Surely CDOs need to accept responsibility for all data work and data tools from the spreadsheet up?
- Find a home for the spreadsheet. Considering that there is an actual plaque at Harvard Business School commemorating the inventor of VisiCalc, it’s unlikely that spreadsheets will be dying off any time soon. Spreadsheets provide modeling tools, data capture tools, and a canvas for mocking up UI for an application. They’re an incredibly good tactical environment, and we should always teach people how to use them for this purpose. We also need to teach why spreadsheets become a problem when data work scales and what tools to use in their place.
Tools, like visualization tools, that allow business users to connect to a source system and to automate their work enable a much more governed version of self-serve analytics that is possible in spreadsheets. They are highly structured, easy to govern, and create outputs that can be managed and shared among colleagues and departments. They may not represent how we’ve thought about self-service analytics in the past, but they certainly point the way to a better future.