
Data Practice
What happens when we lose sight of data ethics?
Published
December 6, 2022
Read Time
5 minutes
Topics
Data ethics

Read Time
5 minutes
Topics
Data ethics
Widely accessible data has shifted how we experience the world. We’re consuming data more than ever before through charts and interactive graphics in the news and at work, and more data is being tracked and collected about us through digital analytics. How that information is managed, stored, analyzed, and shared raises new questions about data privacy, security, and the ‘right to be forgotten’ as described in emerging policies in Europe and elsewhere.
To ignore this transformation from a world that uses data into a world that runs on it leaves the door open to nefarious actors who misuse, misrepresent, and mislead with data. In the most blatant instances, there seems to be a collective condemnation from many data professionals – which can make it easy to ignore the ways each of us must play a role in ensuring the ethical presentation and use of information. However, it’s critical that each of us understand the importance of data ethics and the roles we play in ensuring the ethical collection and presentation of information.
As a public health professional who has spent my career working with data in the federal, nonprofit, and private sectors around the world – including dipping my toes into the work of ecommerce and digital analytics – the pandemic has put on full display the issues and challenges many of us working with data have yet to address around the ways our charts and graphs can (unintentionally) mislead with dire consequences.
Looking forward, pandemics are one example of a shared experience where the decisions of individuals can have a significant impact on the health and well-being of a community. Climate change presents a similar existential crisis that is often misrepresented. As data leaders, we have a responsibility to keep our eyes firmly fixed on an ethical north star around data ethics. Reflecting on the data-saturated COVID-19 pandemic, data leaders should be prepared to address three big challenges around appropriate, ethical use of data, and empower their teams and communities to do the same.
- Understand how data is collected, its limitations, and potential for bias
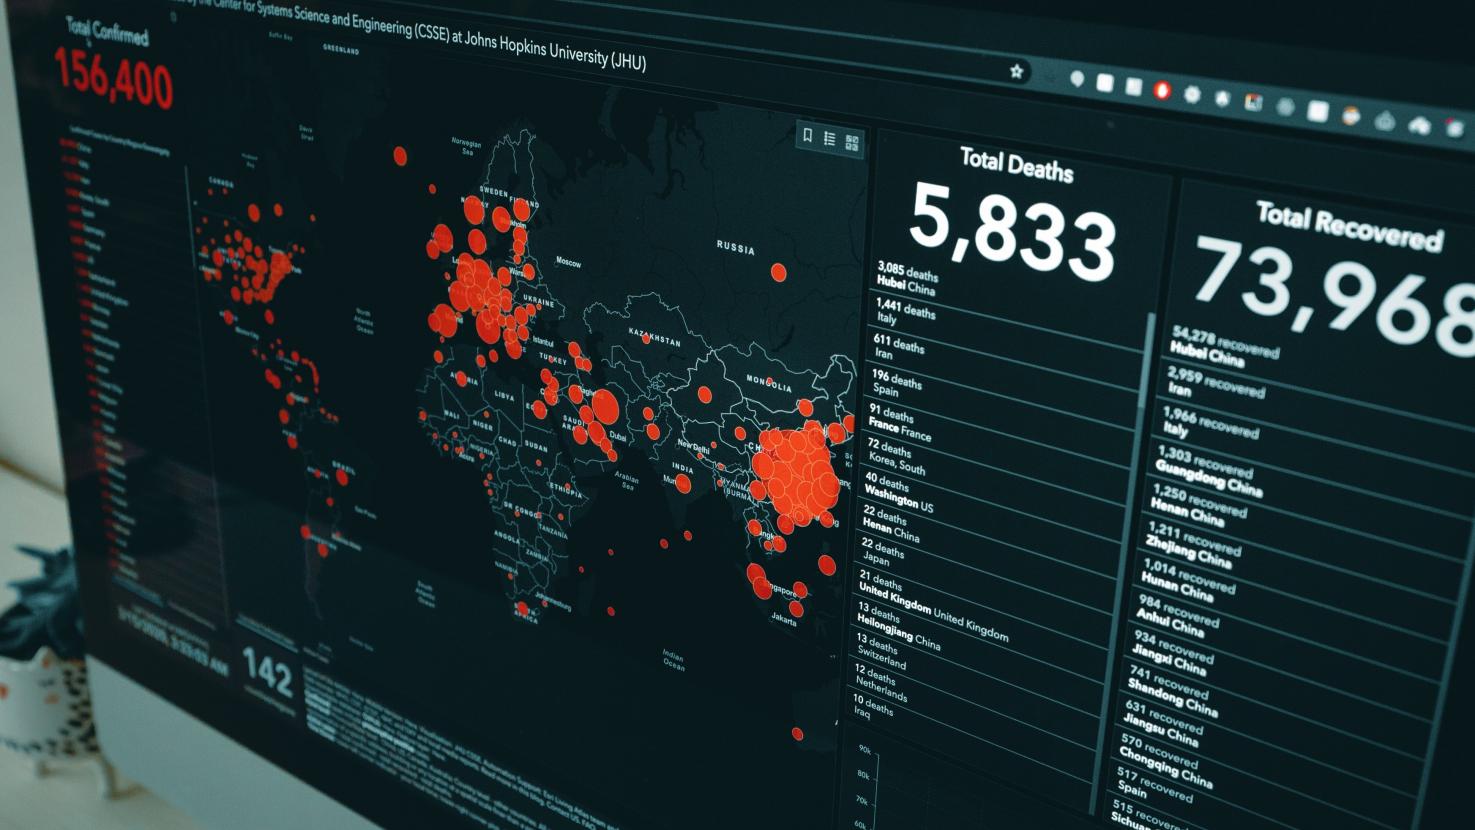
The early days of the pandemic showcased the confusion that charts of incomplete data can sow and shined a light on the ethics of data collection, particularly in an information-starved public. During the weeks and months of February and March 2020, people were hungry for information and watched case curves slowly climb. At the time, counting cases was highly dependent on another metric though: tests administered, which had dependencies on accessibility and availability. The rapid access to ‘real time’ information also understated the reporting lags and data quality challenges that created great uncertainty in those early charts.
Just because a dataset is available for download and use, that doesn’t make it accurate, complete, or timely. Understanding how data is collected, for what purpose, by whom, and with what methods are critical questions for data analysts and visualization creators. Spending time getting to know a dataset – and even creating documentation on it, using a tool like a data biography — should be part of every data endeavor. Otherwise, without a guiding set of ethical practices like these it’s easy to have blind spots around how the data can be used and to create misleading charts or draw inaccurate conclusions.
- Ensure a shared understanding of basic statistical and analytical concepts
I spent years working in monitoring and evaluation, where I was deep in the weeds of research and evaluation methods and creating indicators to measure public health program outcomes. Never did I expect for concepts like test positivity rates, base rate fallacies, or complex case fatality rate calculations to be part of front-page articles - but those are precisely the concepts we needed to have a shared understanding of in order to make sense of the spread and severity of COVID.
At the center of many misunderstandings and misinterpretations of data during COVID is the confusion between correlation and causation. Some debates centered on whether a death was caused by COVID or if someone tested positive for COVID at the time of death - but given our many unknowns particularly early on, making a differentiation is challenging in many cases. The more egregious allegations around causal links centered around vaccination, where some advocates would mine social media and news articles where someone who had been vaccinated against COVID later died (with no noted causal link between the two) - despite deep population data and studies on the safety of the vaccines.
During a time of dramatic change in how we have lived our lives, it’s second nature for many of us to look for data to answer questions about what helped or didn’t in curtailing the spread of the virus. But often causal links between specific actions or policy changes and outcomes were muddled with confounders where many different variables and behaviors were at play - sometimes in ways that were less apparent to those outside of the complexities of health systems and social determinants of health.
Understanding basic statistical measures and common data pitfalls as data leaders is critical to ensuring accurate interpretation of data, whether we’re working in humanitarian settings or occupying a board room. For leaders responsible for communicating complex information to the public, we have the added obligation to distill complexity into language and graphics that can appropriately inform, rather than mislead (intentionally or not).
- Don’t just bring data to a story fight
Data humanism centers the people represented in numbers, defining a bold and impactful way to visualize and communicate complex data about subjects like death and loss.
We’ve seen striking examples in installations like the ‘In America’ flags memorial for deaths from COVID-19, with physical representations of data points that cultivate a sense of empathy and cause us to feel in ways that a line chart may not. Others blended data with narrative and experiences, like Joss Fong’s Pandemic Polarization which combined hand drawn charts and personal stories from COVID survivors and Shirley Wu’s People of the Pandemic game, a simulation that helped us see the impact of our seemingly small individual choices to stay home or socially distance early in the pandemic.
These installations and experiences are rooted in data points, incomplete and flawed as case data may have been. We’ve seen our response to COVID-19 influenced by the ‘infodemic’ often fueled both personal anecdotes that contradict population-level statistics and data points used in misleading ways. Researchers sought to understand how and why misinformation spread. Crystal Lee and her team at the MIT Vis Lab spent six months investigating the spread of anti-mask sentiment and the role visualizations played to emphasize why citizens should not follow broad public health advice around mask wearing. At the same time, more nefarious actors mined for stories that would grab attention and capture clicks by misrepresenting issues like vaccine safety.
As we grapple with big questions around data ethics, we can look to the work of community leaders like Bridget Cogley who have written extensively about the intersection of ethics and data visualization, and seek to learn from other fields and industries that have been working to put guardrails in place to prevent the misuse of data, including leaders like Timnit Gebru and the broader computer science and artificial intelligence domains. We can also examine our own role, as data professionals, in centering ethics in our work.
Despite the many efforts around automation, people still play a crucial role in setting the tone for how organizations collect, analyze, and share data. Data leaders are in a unique position to enable their teams to understand the importance of data ethics and take it into account in the development of new data experiences for customers, decisionmakers, and the general public.