

Data Practice
What Data Leaders Should Know About Knowledge Graphs
Published
May 4, 2023
Read Time
5 minutes

Read Time
5 minutes
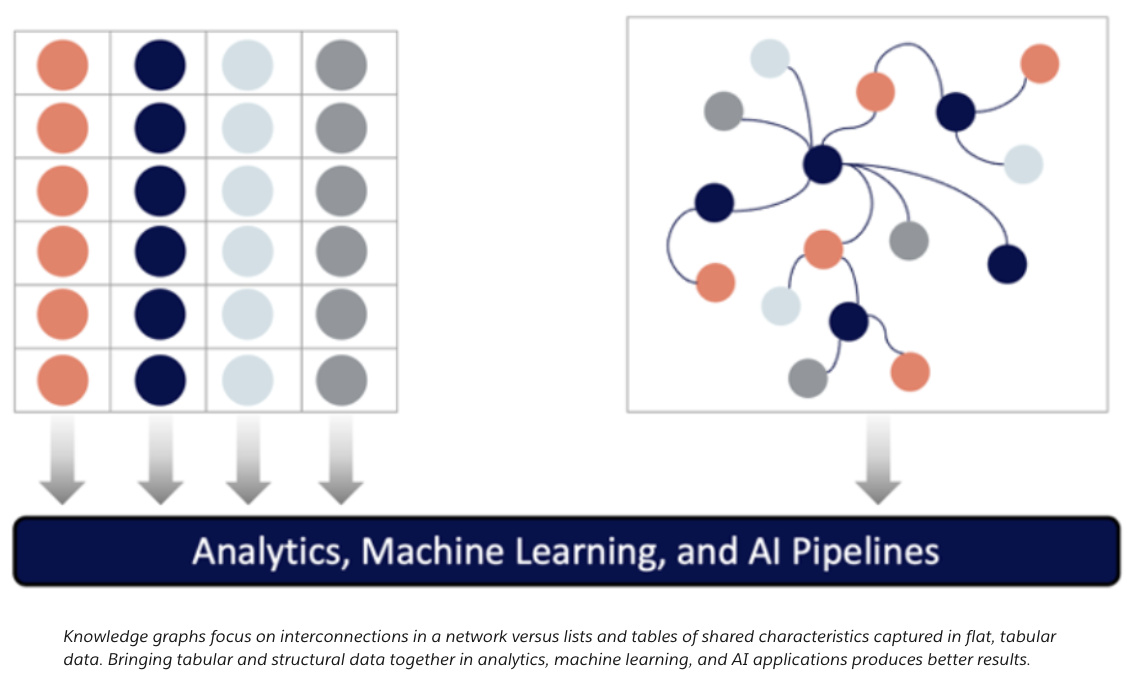
Like a lot of data professionals, I’m passionate about analytics. I’m particularly excited about knowledge graphs, because they offer an unparalleled ability to see the connections between things and better understand complex systems. That’s another way of saying something you probably already know – that database tables and rows really can’t tell you the whole story. If you want to depict how people, biological systems, product fulfillment, or even traffic patterns interact, knowledge graphs are the way to go.
Dumb devices, smart behavior
My own involvement in knowledge graphs came about accidentally. Nearly a decade ago the company I was working for started seeing unusual behavior with some IoT devices. Based on our observations, they were actually making decisions even though they were dumb devices by design.
On further examination, it was the interconnections and relationships the devices had with each other that caused the unexpected effects, much the same way that you see behaviors among colonies of ants or flocks of birds that can’t be predicted by observing individual members. You can predict – and model – these things with knowledge graphs.
How different is a business from a flock of birds? If you think about both as collections of relationships and interactions, they’re actually pretty similar. Business relationships drive more business. Relationships are the DNA and the structure of how things operate. The same is true of a supply chain, another complicated system defined by interconnections. After the recent pandemic, you’re probably aware of how much disruption one area of a supply chain can wreak when it ripples through the whole. It’s the role of knowledge graphs to help us see those larger pictures so we can understand the system-wide impact.
Knowledge graphs in application
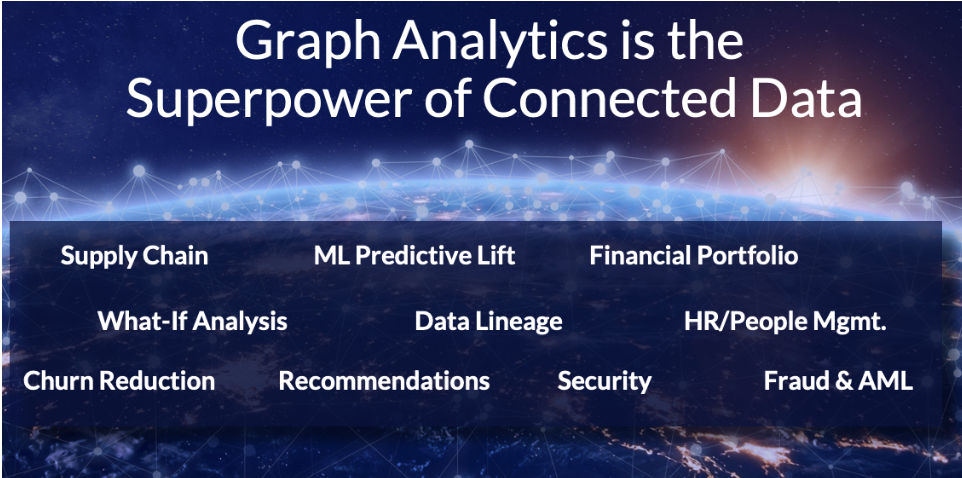
We can use knowledge graphs to identify all sorts of non-intuitive effects and outcomes. Here are just a few of the possible benefits:
- Better marketing spend insights. Consider something at the heart of almost every home: family cellphone plans. Knowledge graphs have been used to demonstrate that the most influential person in a family network plan is the mother. If the mother changes her phone plan from Carrier A to Carrier B, her network is more likely to change over as well. Most churn reduction marketing is probably wasted.
- More contextual recommendations. Amazon has taken a graph approach for years, but retailers like home improvement stores are rapidly catching up. If you’re searching for a bath faucet, it’s of limited utility to be shown 500 more bath faucets once you’ve narrowed down to one. With knowledge graphing you can suggest what’s related and relevant to the entire bathroom project, not just the faucet product: sinks, bathtubs, toilets, showerheads, mirrors, tile, and so on. Companies able to apply graph analytics to these scenarios thanks to an understanding of the broader context are seeing significant revenue gains.
- Greater success in managing societal issues. Knowledge graphs have been used to find fraud linked to credit card and insurance fraud, but also to identify opioid prescription fraud and smoking cessation strategies. With smoking, it turns out that we can better predict if you’re going to quit based on friends of friends of friends – people within your social network but not necessarily someone you directly know.
- Stronger generative AI. Yes, knowledge graphing can greatly improve ChatGPT, LLaMa, Bard, Ernie bot, and any other generative AI application you’ve been hearing about every hour for the past five months. That’s because AI algorithms will be more situationally appropriate as they incorporate contextual information that is naturally contained in knowledge graphs. Again, this is because knowledge graphs are designed to illustrate structured, interconnected representations of data.
Three ways to begin the conversation
As a data leader, part of your role is to spark conversations about developments like knowledge graphs, but do so in a way that excites your colleagues rather than intimidates them.
As a data leader, here are a few things you can do now.
- Share information. There is a lot of information out there to get up to speed on some of the concepts of graph computing. Here are a few suggestions: The Practitioner’s Guide to Graph Data, Knowledge Graphs, Graph Data Science for Dummies, Graph Algorithms.
- Get teams thinking ‘graphy’ versus ‘mathy’. Solving some problems simply makes a lot more sense using knowledge graphs. If you’re just trying to estimate how much to pay your sales force, that’s a mathy problem. If you’re trying to combine a customer’s past and current purchase patterns with their customer service interactions and social media behavior to do more contextual 360-selling, that’s definitely a graphy problem.
- Start connecting your data silos. Where are your data silos, and where does one data silo best connect to another to create a foundation for graph computing? Connecting the data you already have and updating metadata are often the lightest lift to get started.
This last suggestion is particularly apropos because the computing industry is on the cusp of a new generation of tools and technologies that are purpose-built for knowledge graph work in everyday organizations. The good news is that you’ll soon be able to leverage existing data infrastructure and systems for knowledge graphing and analytics, and won’t need teams of data scientists dedicated just to data ingestion.
As with so many other technical topics, humans are very good at confusing people with technical terminology. When it comes to knowledge graphs, just focus on the fact that we will soon be using more knowledge graphs to unearth connections, and connections are just how the world works. It’s ultimately how we should be looking at nearly every data problem.